Yield Curve, Impulsive Move, Recession
For those who believe yield curve doesn’t matter, before you read on further, just remember that yield curve inversions have preceded the last seven recessions and nine out of the last 12 recessions. The last yield curve inversion that did not precede a recession was in the mid 1960’s. Now some may argue it is different this time because great printing presses at the Fed that have replaced traditional interest rate cycles have clouded the relevancy of this indicator. Perhaps that’s true, but only time will tell.
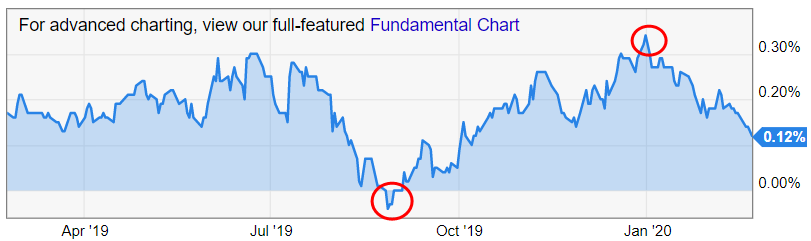
How Yield Curve Behaved From August 2019 to Currently – Back in August 2019, it was the first time since 2008 GFC that critical yield curve, known as the spread between yields of 10 year and 2 year bonds, briefly turned negative and as a result calls for a pending recession in the US went up sharply as PMI/ISM fell below 50 (contraction) driven by US-China economic war. But the yield curve didn’t stay negative for too long. Recession calls were only relevant to the extent in which we were seeing softness in US manufacturing sector. Otherwise, Services, which is 70% of the US economy, never contracted below 50 and labor market remained quite strong.
Then gradually from August 2019 to January 2020 the 10-minus-2 yield spread increased to +34 bps. In last few weeks the spread has shrunk again and currently at +12 bps and this time too it has come with disappointing PMI data points globally. The big difference this time is PMI Services fell below 50 according to latest IHS Markit data. If this declining trend in yield spread continues, it will likely turn negative again in coming weeks or by April. To be clear, we still don’t see troubles in labor market. No signs of that yet, although arguably the “rate of YoY growth” in monthly job gains has decelerated gradually from +2.6% YoY to now essentially flat over the course of past 24 months.
The big question is whether what we experienced in equity market from Aug 2019 to Jan 2020 period was the final impulsive move of bull market. The total move in S&P during this period was +19% and 6 months.
To put this in perspective, in light of yield spread, here is once again a refresher of my discussions with Jaguar clients in the past:
Connection Between Yield Spread and S&P Impulsive Move – Sometimes the S&P peaks within two to three months after 10 minus 2 spread turns negative. Sometimes it takes up to 2 years for S&P to peak. Looking at last 10 observations back to 1956, the S&P topped out within approximately three months of the inversion six times (1956, 1959, 1965, 1973, 1980, and 2000). The S&P took 11 to 22 months to peak after the other four inversions (1967, 1978, 1989, and 2005).
The S&P tends to peak 7.3 months (average) or 2.6 months (median) after a yield curve inversion. The range of S&P peaks is from 1.6 months (1973) to 21.6 months (2005) after the inversion – a wide range.
The equity market is essentially on borrowed time after the yield curve inverts. However, after an initial post-inversion dip, the S&P can rally meaningfully prior to a bigger US recession related drawdown. History shows the initial post-inversion drawdown is -5.2% on average. The drawdowns typically last two months. After the initial drawdown, the S&P can have a meaningful last gasp rally. This rally has averaged +16.7% and 6.7 months. Range of rally is wide from +2.0% (1965) to +28.5% (1989) and time frame is also wide from 0.9 to 16.5 months. The 1967, 1978, 1989, and 2005 inversions saw last gasp rallies in excess of +20% on the S&P. Even during early 2008 when financial system was collapsing, the S&P saw a final gasp of large rally from February to April 2008 before final leg down happened in S&P.
Did We Just Experience Strong Impulsive Move? – So, we had first brief inversion in Aug 2019 followed by huge +19% run in stocks in just about 6 months. Now yield curve is shrinking again. If the history is rhyming here, then either we just experienced strong impulsive move in equity markets that led to sharp multiple expansions to historic levels, or perhaps we are still in that impulsive move that it hasn’t run its course yet (more on this point later).
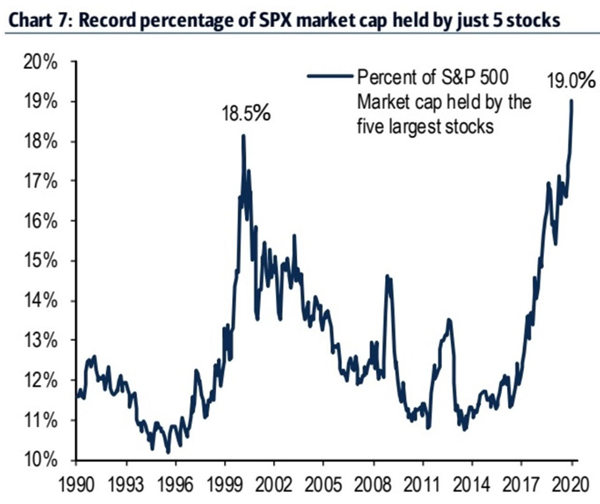
Last week in webinar with Jag clients we were thinking how Nasdaq looked quite stretched trading 8% above the 50-day and 20% above 200-day moving averages. In reality, the impulsive moves are so powerful that when we look at 1999-2000 years Nasdaq was frequently trading 50% above 200-day, reaching all time peak of 96% above 200-day. Back then too pullbacks were harsh and quick, followed by powerful V-shape reversals back to upside. We experienced the same in 2006-07 impulsive move, except it wasn’t in Nasdaq but in credit, banking sector and energy. This time ESG flows are driving price action wild in many stocks. Microsoft is top weight in over 600 ESG-focused funds that have sprung to life in past 12 months at accelerating rate. Meanwhile, just 5 stocks in S&P Index now command 19% weighting in entire Index, a level not seen since late 1990’s. While I’m sure everyone has seen wild moves in TSLA and SPCE. Can we say Robinhood and all commission free trading is contributing to retail participation that had been previously lagging from market for many years?
Fahad