Apple (AAPL) – Risks Around iPhone
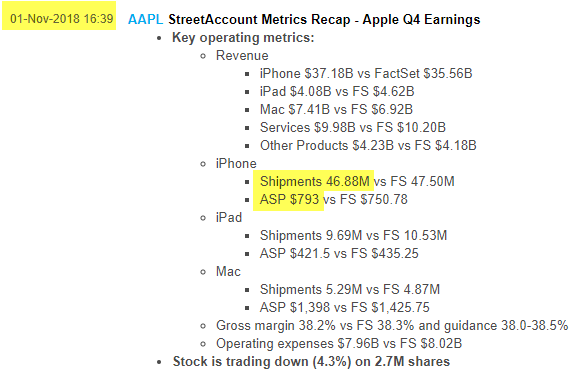
About 59% of total revenues come from just iPhone. iPhone unit sales growth not only missed consensus (46.88M vs 47.5M estimate) but to me most important thing is absolute numbers (not vs consensus). In absolute terms iPhone unit sales growth of just +0.4% YoY is the lowest I have seen in 11-year iPhone history (46.88M vs 46.68M same quarter prior year).
This is not what you want to see from a product that is 59% of total revenues. It also doesn’t help that CFO said in earnings call last night that they will stop giving out unit sales data in the future. You can read between the lines here.
Here is same September quarter in 2017:
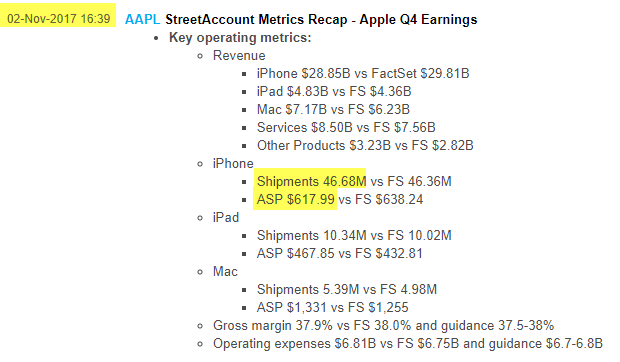
Last year same September quarter, iPhone (all models together) ASP was $617.99. This year in September quarter ASP was $793. That is $175 or +28% increase YoY in ASP. Thanks to iPhone X which was launched last year to celebrate 10-year anniversary of iPhone, the most expensive smartphone on the market. But now do that math. With 1-year anniversary over, those YoY ASP growth comparisons will get tough from here. I expect ASP growth to flatten out.
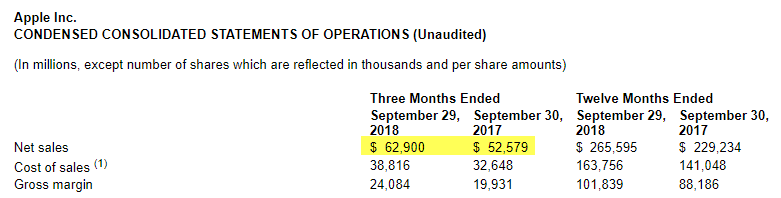
Take $175 ASP delta and multiply by 46.88M units. About $8.2 billion of total company wide $10.3 billion increase in YoY revenues came from higher iPhone ASP. Think about that for a minute. If you remove the impact from higher iPhone ASP, total revenue growth in company was only +4% YoY, significantly below +20% as reported.
Please note iPad ASP declined last quarter. iPad ASP was $421.5 vs $467.85 same quarter prior year (down -9.9% YoY). iPad may have had more competitive threats so perhaps it is anomaly that can be ignored as an outlier. But note given similarities between end users of both iPhone and iPad, perhaps the whole ASP scale across all products is flattening out and/or will start to shift lower. It is not entirely inconceivable to think that iPhone unit growth as well as ASP has peaked, specially with number of highly attractive lower priced competitive products. Perhaps it has to do with entry of Google Pixel phone that was absent from competitive landscape previously.
With all this background, the question becomes what earnings multiple is one willing to pay for Apple.
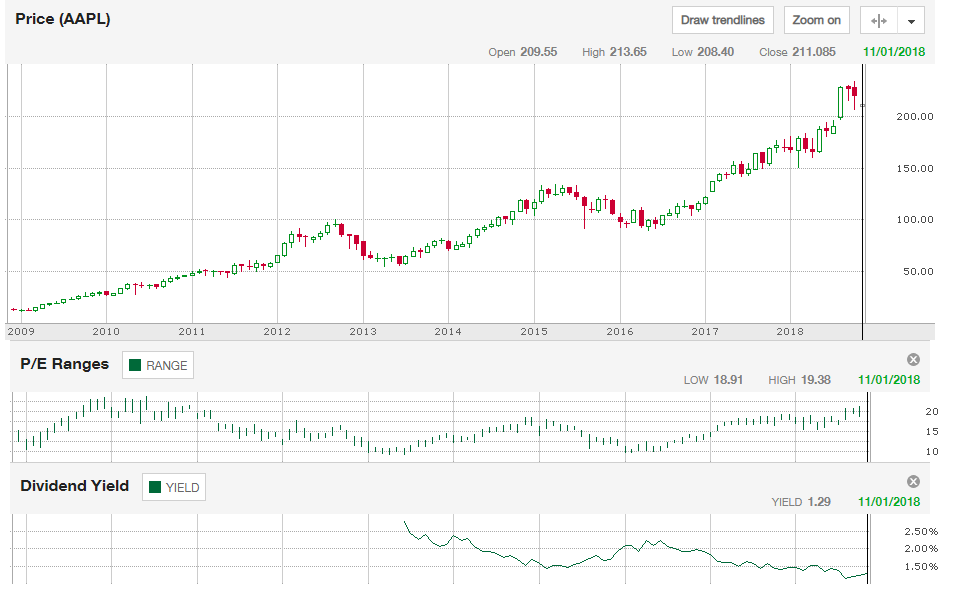
— From 2012 to 2017 the PE on stock ranged from 10.4x to 15.1. This is based on trailing 12-month data. Currently based on “forward” published earnings estimates (which by the way do not take into account potential ASP flattening and unit sales turning negative), stock is trading at 15.4x PE. If you used trailing 12-month for proper comparison, stock is trading at 17.8x.
— If your logic was attractiveness of dividend yield, well that’s not there either with current annual dividend yield of 1.3%. Lowest since company started giving out dividend.