Behind the Numbers – US Silica (SLCA)
We typically publish Behind the Numbers analyses on companies immediately following their earnings reports. But sometimes, it’s worth going back and having a look at recent notable reports that may have gone under the radar, especially when technical analysis shows the stock on the cusp of breaking out, accompanied with fairly heavy open interest in medium-term call options.
US Silica is one such company. This is a US-based producer of whole-grain commercial silica, used in oil and natural gas production (which accounts for 56% of their total annual sales and 49% of total operating income) as well as the manufacturing of glass & specialty materials (44% of sales and 51% of income). Oilfield services and exploration & production companies that engage in hydraulic fracturing (aka fracking) make up the largest proportion of their customer base, followed by glassmakers, and metal foundries.

The company reported the following headline numbers for Q3 on October 28th:
– EPS of $0.43 vs $0.41 estimate and year-ago ($0.27) – Beat
– Revenue of $418.8M vs $402.2M estimate and year-ago $388.5M – Beat
– EBITDA margin of 24.5% vs 23.9% estimate and year-ago 11.8% – Beat
– Free cash flow of $55.2M ($11.1M in total capex)
– Cash and equivalents totalling $267.1M ($1.11B in total debt)
Beneath the hood, two things also stood out:
- Profitability amid supply tightness. The Oil & Gas segment contribution margin per ton improved by 11.2% QoQ to $24.38 and nearly tripled on a YoY basis. This strength looks set to continue driven by lack of supply, with CEO Bryan Shinn revealing in the conference call “85% to 90% of our capacity sold for 2023 and pushing upwards of 70% under contract for 2024”. As such, their anticipated ~9% (~10M tons) capacity increase through 2023 “will be easily absorbed into the market”.
- Stronger balance sheet. The company paid down $50M of debt during the quarter, taking its total YTD debt retirement to $150M. Notably, net debt to EBITDA has now fallen to 2.9x (already well below their previously-stated year-end 2023 target of 3.5x) vs 5.7x at the start of the year. Management remains focused on continuing to de-lever the balance sheet by keeping $40M to $50M of capex within operating cash flows.
Looking ahead, CEO Shinn would also note regarding the Oil & Gas business:
“We continue to see very strong demand for our products and services into the oilfield. I also believe that Q1 is going to start off strong. If you look at our earnings last year, they were a bit lower in Q1 and then ramped up throughout the year. It seems to me like we’ll probably start off much stronger in Q1 of next year… There are lots of experts out there and people with opinions on what’s going to happen. I tend to pay more attention to what our customers say, and more importantly, what they do. And what our customers have been doing is coming to us, wanting to sign multiyear long-term contracts. So that tells me that customers believe things are going to be tight, and I would expect a good start to 2023 as a result of that… With the current energy cycle anticipated to last for multiple years, our customers have been determined to secure sand supply and continue to sign attractive multiyear contracts. These contracts have recently included paying cash upfront in the form of a capacity reservation fee, the latest of which was signed a few weeks ago.”
As shown by the table below put together by Stifel, Baker Hughes and Rystad estimates show US frac sand demand is expected to grow 21.1% in 2023 to 149.6M tons vs 123.5M in 2022:
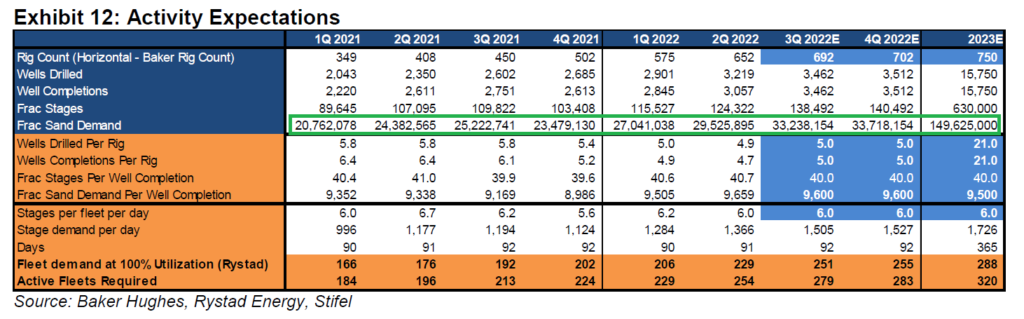
This would imply US demand for frac sand next year will be about 7% higher than the projected output of ~140M tons (based on Enverus estimates), or a ~9.8M ton shortfall. This should act as a further tailwind for pricing. Note that we have already seen prices as high as $55 per ton during 2Q22 vs $22 at the beginning of the year.
Meanwhile, regarding the Industrial & Specialty (i.e., glass and materials manufacturing) side of the business, Shinn said:
“Currently, our base case 2023 forecast is for increased sales volumes with improving margins. We have not yet seen meaningful indications of potential recessionary impacts, but obviously, there’s a lot of noise in the market right now. I’m encouraged that several key customers are relatively bullish regarding demand next year and that they are continuing to sign attractive long-term contracts with us.”
Ultimately, it’s all about free cash flow
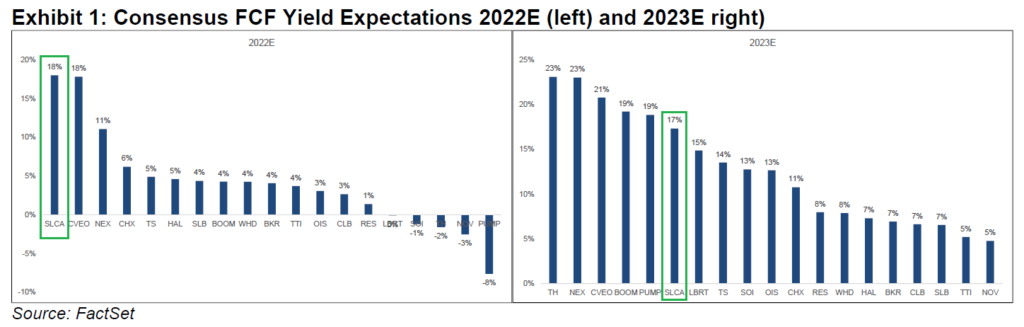
To finish off, Stifel in their most recent oilfield services summary (on October 18th) would highlight that based on FactSet data, US Silica’s free cash flow yield is expected to increase materially this year and next, based on continued strong operating performance and low capital spending. The company currently leads their entire sector coverage alongside Civeo (CVEO) with forecasted FCF growth of 18% in 2022, and is expected to follow up with 17% growth in 2023.
Additionally, the firm notes:
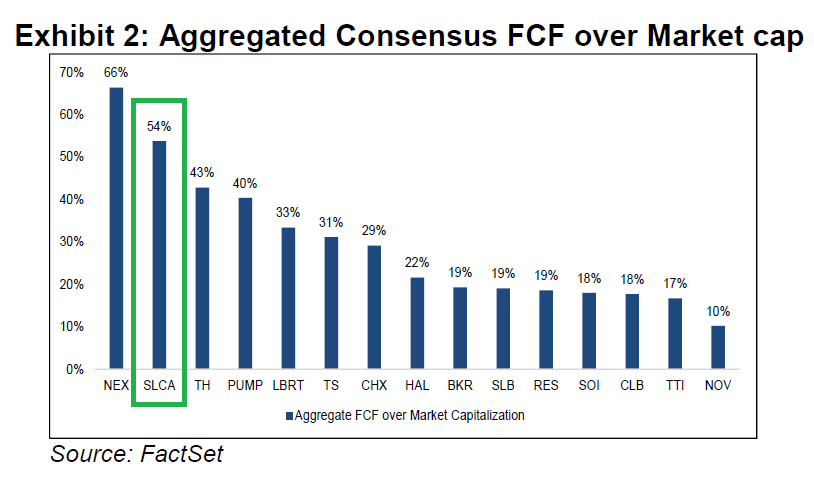
“The leaders in aggregate FCF generation through 2024E as a percentage of market cap include NEX, generating a forecasted 68% of its current market cap in FCF, SLCA, generating a forecasted 54% of its market cap, and TH, generating a forecasted 43% of its market cap. Looking more broadly, the average aggregate FCF generation as a percentage of market cap for our coverage universe is roughly 30%, with companies having outsized exposure to US onshore activity leading the charge.”