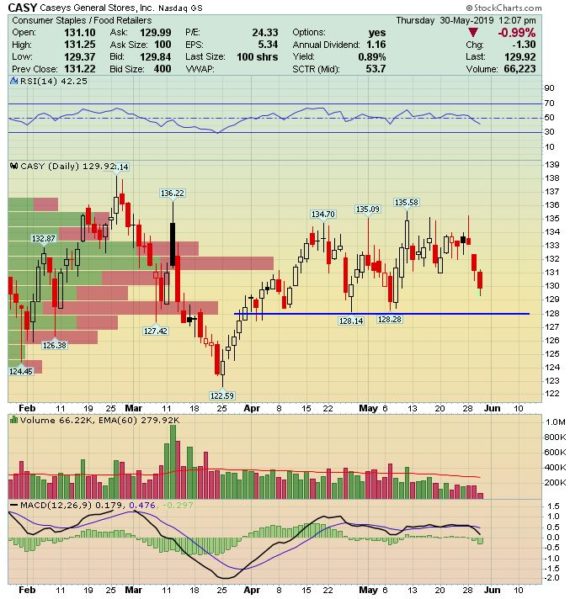
Casey’s General Stores (CASY) – Trends from the C-Store
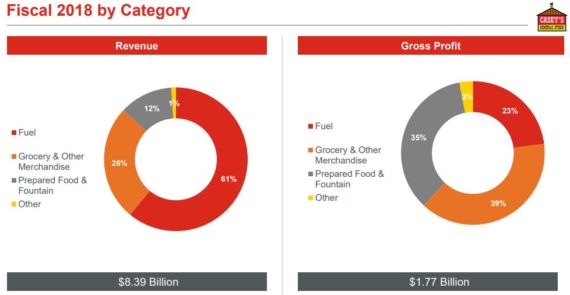
Casey’s General Stores, Inc. operates more than 2,000 convenience stores in 16 Midwestern states. Casey’s offers self-service gasoline, a wide selection of grocery items and an array of freshly prepared food items.
Earlier this week, BMO Capital was out with a C-Store Monitor note that provided in-depth analysis of the IRI convenience store channel.
**IRI’s Convenience Store channel data (called AllScan) include in-store merchandise sales data (ex-gasoline) based on census data (or actual scanner data including top industry c-store chains) as well as sample/projected data (IRI projects total sales based on data from a sample of stores). The IRI AllScan data include small-format stores (500-3,000 square feet in size) that carry 500-1,500 SKUs that 1) are open for at least 13 hours a day; 2) have at least one checkout; and 3) carry a limited selection of grocery items.
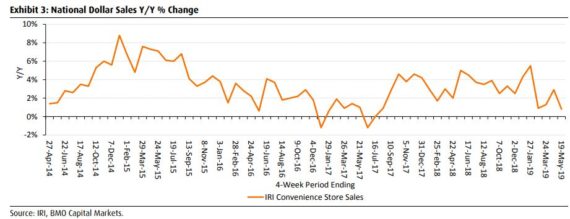
According to the IRI All Scan data, national average c-store merchandise sales grew +0.8% Y/Y in May, a moderation relative to the revised +2.9% in April, and below the prior 12-month average of +3.0%.
The data would also say that U.S. national miles driven, averaged a Y/Y decline of -0.1% for the months of February and March, decelerating from a 1% increase in the November-January period. Weighted for CASY’s store distribution by state, miles driven in CASY’s regions decreased by an average of -0.9% Y/Y in February and March, compared with -0.7% in F3Q19, suggesting that weak trends highlighted in F3Q19 have likely continued into F4Q19.
In addition, IRI’s data showed that national cigarette volumes are 79% correlated to CORE’s cigarette carton comps over the last 21 quarters. Through the first seven weeks of calendar 2Q19, IRI data points to a national average cigarette volume decline of -6.9% vs. -5.8% in 1Q19 and the prior 12-month average of -4.5%. This is a negative read-through for CASY based on what we heard from CFO William Walljasper on the company’s last earnings call in which he said:
“So tobacco trends, just to give you some metrics there, roughly about 75% of our cigarette sales are still in the pack, that really hasn’t changed much.”
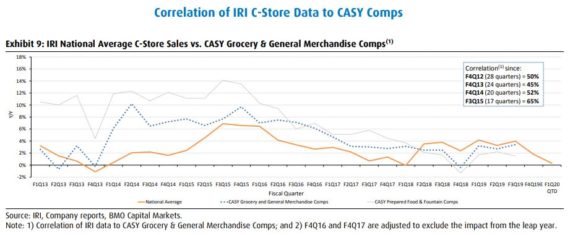
Finally, in the BMO Capital note, after incorporating the last week of CASY’s F4Q19E (ended April), their custom-cut CASY c-store index is +2.1%, suggesting stable trends sequentially which is generally in-line with our model and an outperformance relative to the national average which is sequentially weaker. However, the first three weeks of May (CASY’s F1Q20) have started out much weaker at -1.2%. This custom index has an 88% correlation to CASY Grocery & Other Merchandise comps over the last 17 quarters.