Thoughts on Markets, Sentiment and Inflation
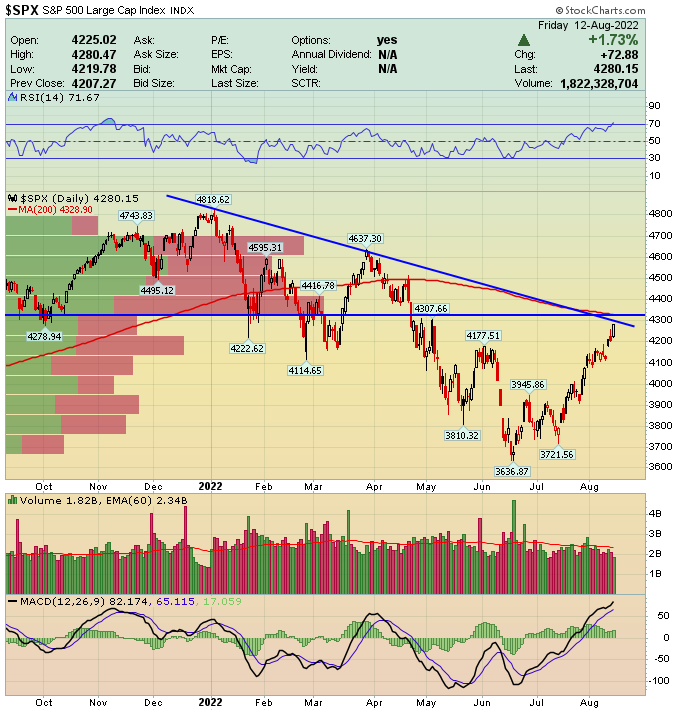
S&P 500 Index – Now comes a big test at 4300. The S&P closed at 4280 on Friday. The downtrending resistance resides at 4295, the VoP at 4320 and the 200-day moving average at 4328. Cluster of levels within 1% above the current level that technicians care about. The RSI is now 71 on daily scale.
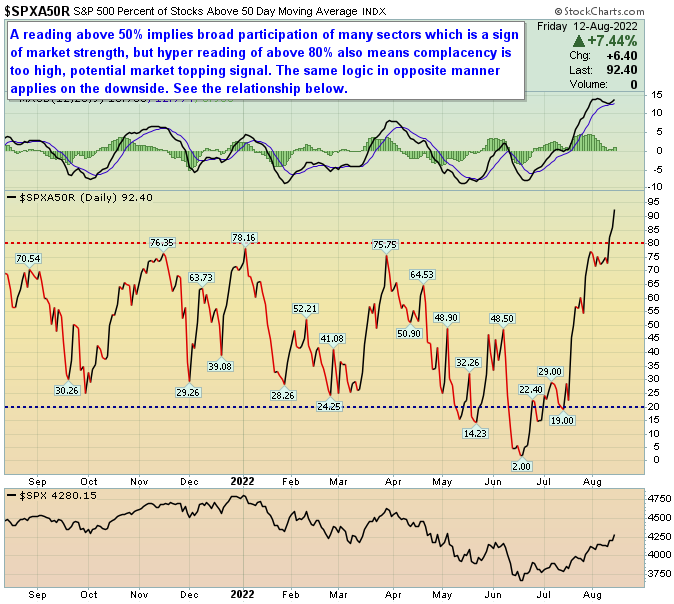
Market internals are extending into stratosphere levels. The 10-day CBOE Equity Put/Call ratio is now at the lowest level in 4 months as the need for index hedging disappears and VIX under 20. Cost of insurance has collapsed. 92% of stocks in the S&P are now above the 50-day MA. Note just two months ago in mid June this reading was at just 2%. We have gone from extreme bearishness to extreme bullishness in 7 weeks.
The NAAIM Exposure Index has bounced sharply from low of 19% on June 22nd to 71 as of Thursday last week. Sizeable increase in bulls. Similarly, the AAII Investors Sentiment Survey has gone from 18% bulls / 59% bears on June 22nd to 32% bulls / 36% bears as of Wednesday last week. For reference, only one other time % of bulls have been higher (almost 33% on March 23rd) than current level all year. That level in March coincided with S&P trend resistance then a swift market sell off followed. Goldman Sachs late on Friday:
“The Prime book has seen short covers for 4 straight weeks (in 17 of the last 20 sessions) and this week saw the largest dollar covers since December 2021. In cumulative dollar terms, the short covers over the past month were among the largest over the past decade“
You saw this all last week with meaningful “Dash for Trash” rally in the highly shorted stock basket. To put this vicious rally in context, GS also points out the net impact on financial conditions has been equivalent to 150 bps of Fed interest rate cuts. The “meme basket” is up +52% since June low, 2nd highest ramp in percentage terms since March 2022 and prior to that you have to go to 1Q21 to find comparison. It’s hard to understate the magnitude of short covering seen in past two months.
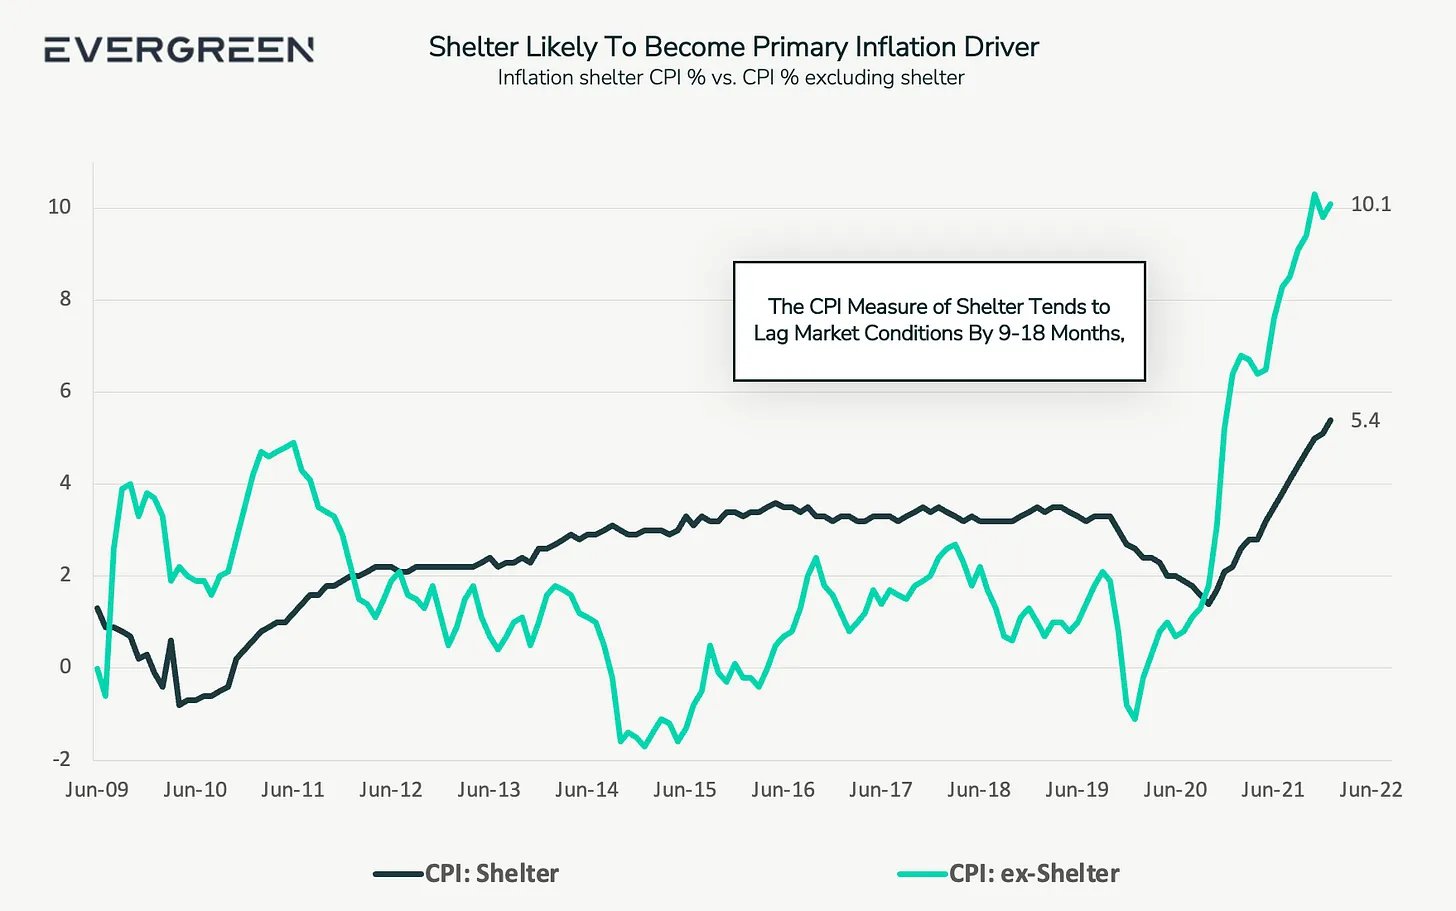
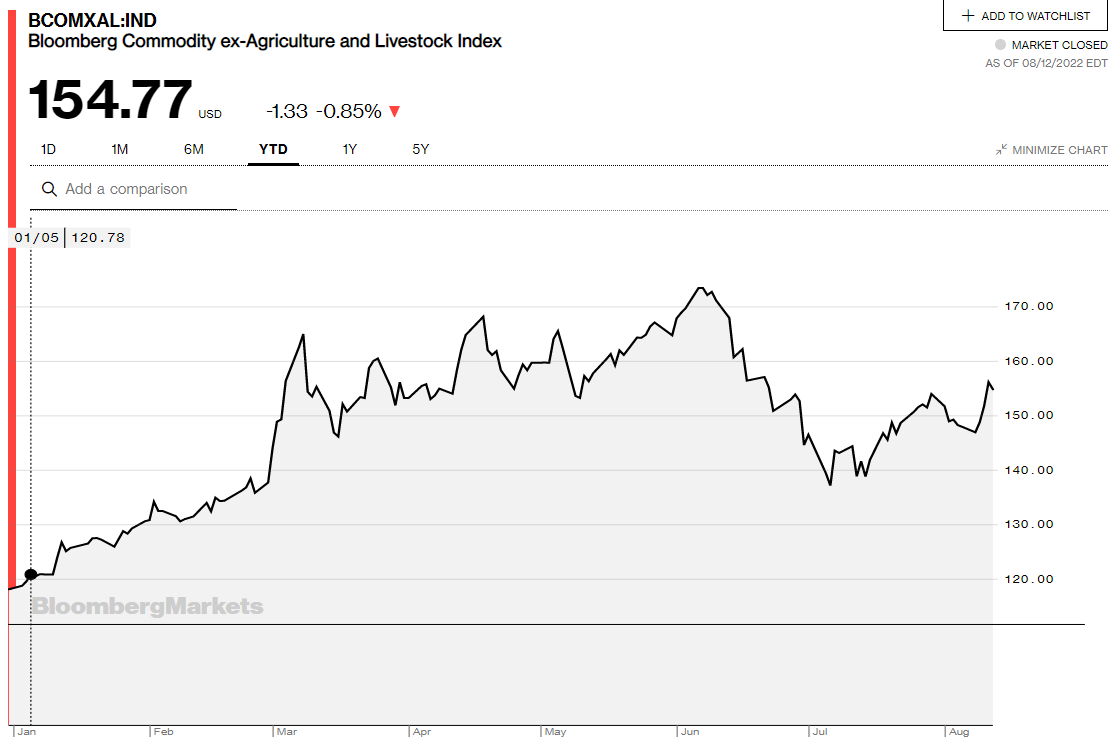
Inflation & History – The sequential m/m drop in CPI from 9.1% to 8.5% is most certainly welcome news, but there are puts and takes. First thing is I don’t care what anyone says, the absolute reading of 8.5% is Sahara Desert hot. Secondly, none of “sticky” components in CPI rolled over. About 41 bps of 60 bps sequential m/m drop was driven by energy alone which represents 9.2% weighting in CPI calculation (please note RB Gasoline futures are flat for past 4 weeks). Shelter component accelerated m/m and is now displacing energy as the biggest driver of CPI. Shelter is sticky. Regarding food, it didn’t slip at all in CPI last week. There is 8 month lag between when Bloomberg Agriculture and Livestock Index and food prices. When this Index goes down, 8 months later you see food prices in grocery stores go down. Guess what? That index is up +10% since early July bottom. See chart below.
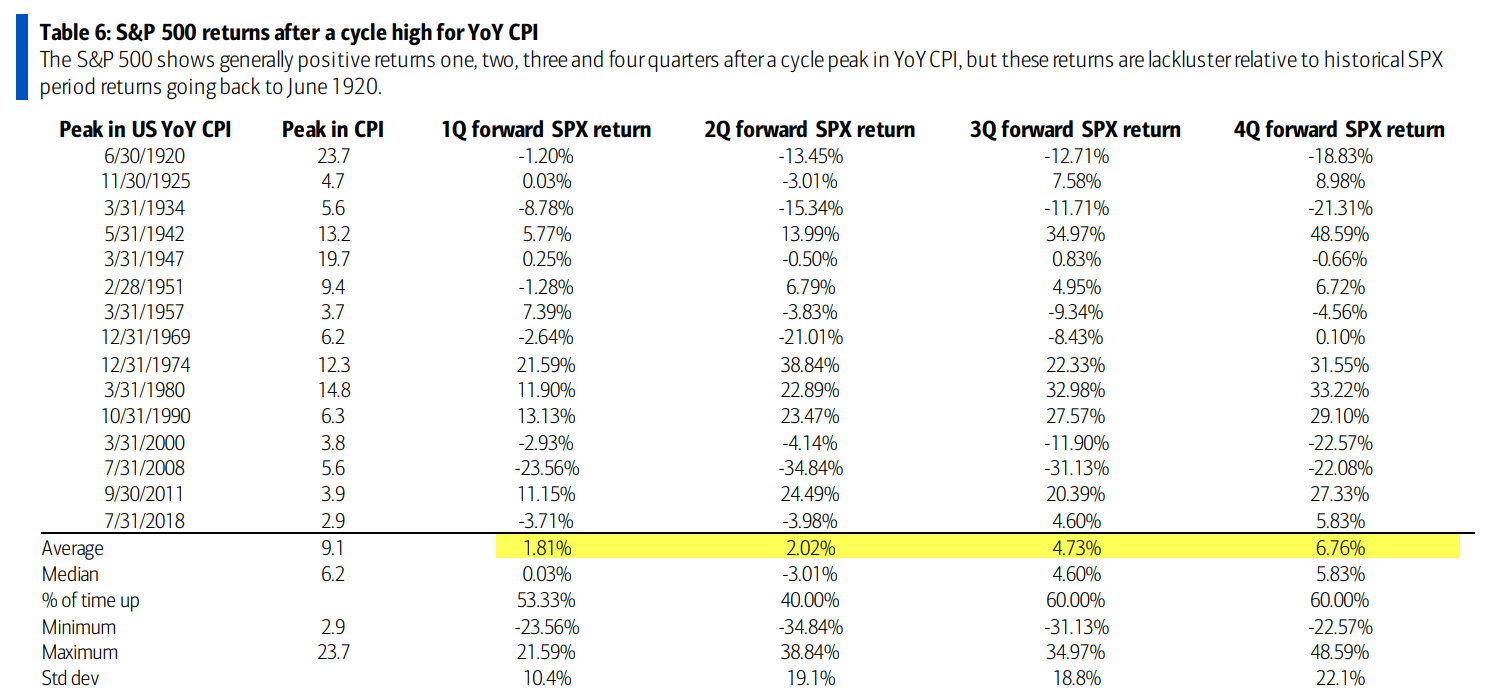
An interesting history from BAML:
“A 1-month drop in YoY CPI from the June level of 9.1% is not necessarily a trend, but investors are asking what happens to the SPX after a peak in CPI. If the YoY CPI cycle peak was in June or an event for a future month, the SPX has generally positive average and median returns one, two, three and four quarters after a peak in CPI, but these returns are lackluster relative to historical SPX period returns going back to June 1920.”
See table below. What we may have seen observed in past few weeks is sugar-high rush to re-rate equities higher on assumption we are about to see inflation collapse and the Fed to go dovish. Are we rushing too soon to make these assumptions? The fact TLT and SHY didn’t even budge is telling me something.
Watch Shelter – Shelter is part of core CPI which excludes food and energy. It accelerated m/m last week and historically there is 12-18 month lag between when the Fed turns dovish and when rent peaks. Two quick thoughts on this: First, the very fact neither the 10-year bond (TLT) or 2-year bond (SHY) showed any signs of yields collapsing after CPI/PPI last week is a hint that Fed’s hawkish stance is likely to go beyond what is projected by street estimates currently (which is peak Fed Funds at 3.5% by year end). If this hawkish view continues beyond December, stocks are in trouble. Second, the longer the Fed hikes, the longer (and higher) the 30-year mortgage rates remain elevated. That keeps perspective borrowers for homes out of the market as affordability remains tough (and lets not even think about what does rising weekly jobless claims mean for labor conditions in coming months). With tough affordability, rent remains high and that’s sticky inflation. To fight that inflation, the Fed keeps hiking. The more they hike, the more affordability tightens, the more rent prices remain elevated. The cycle continues until demand destruction takes hold. Reminder, housing is 14% of GDP and it directly employees 14 million Americans and many more millions indirectly.