Top 10 Charts of the Week
First time making this type of post. Time permitting, will try to make this a recurring thing on home page with top 10 eye catching charts each weekend.
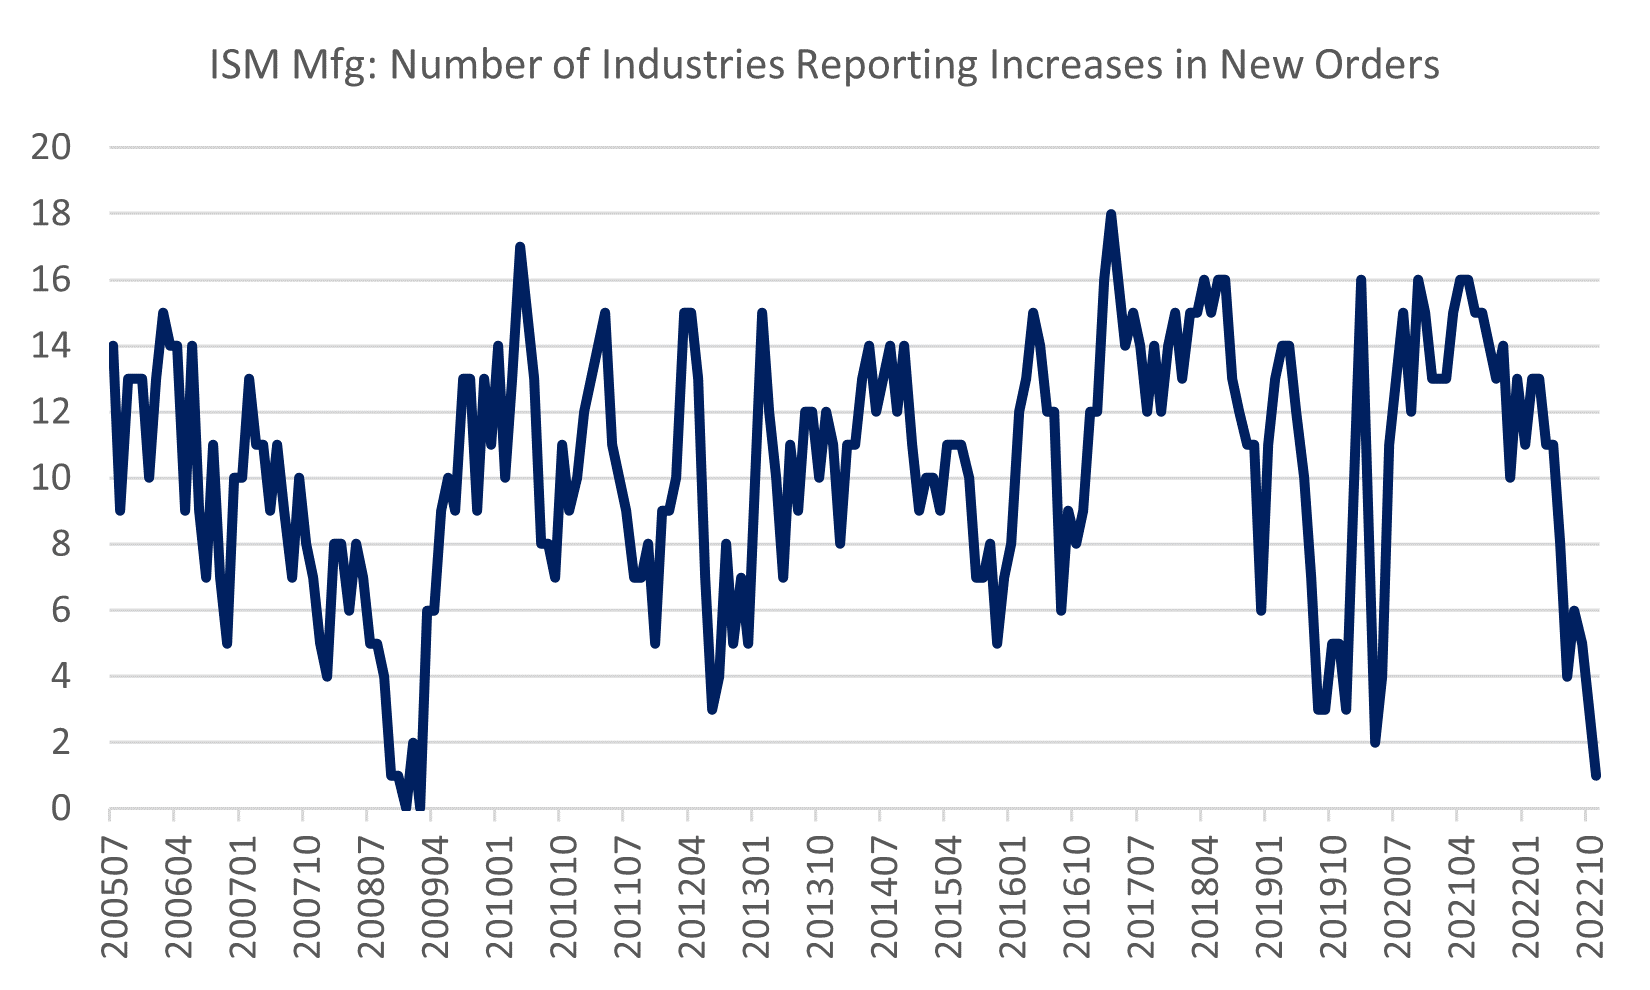
New Orders from ISM Manufacturing Survey showed only 1 of 18 industries reported higher orders sequentially m/m, lowest since November 2008. Share reporting higher orders down from 13 in March to 1, biggest 8-month drop since data began in 2005. Overall, New Orders (leading data for XLI, IYT, XLB) in November fell to 47.2 in November vs 49.2 in October, 3 consecutive months in contraction.
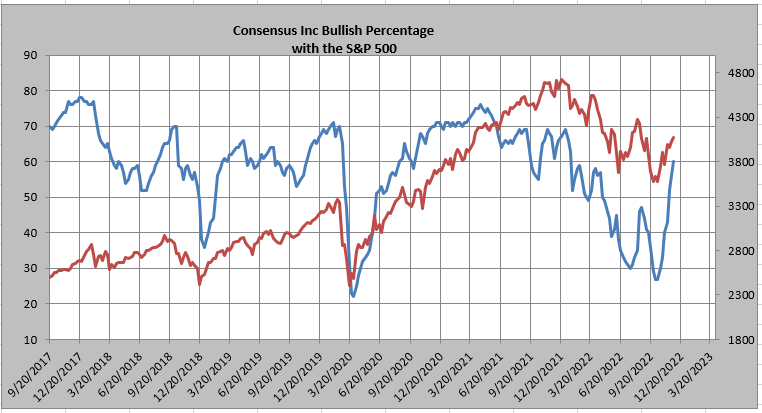
Thanks to recovery in stock prices amid persistent obsession with Fed pivot on daily basis ever since the last headline CPI reading fell by 50 bps m/m to 7.7% annualized rate, the consensus bull percentage ratio has climbed sharply higher now at 60%, most since January. This reading was 27% at the lows 2 months ago. For those who think everyone is bearish, sorry but you are wrong!
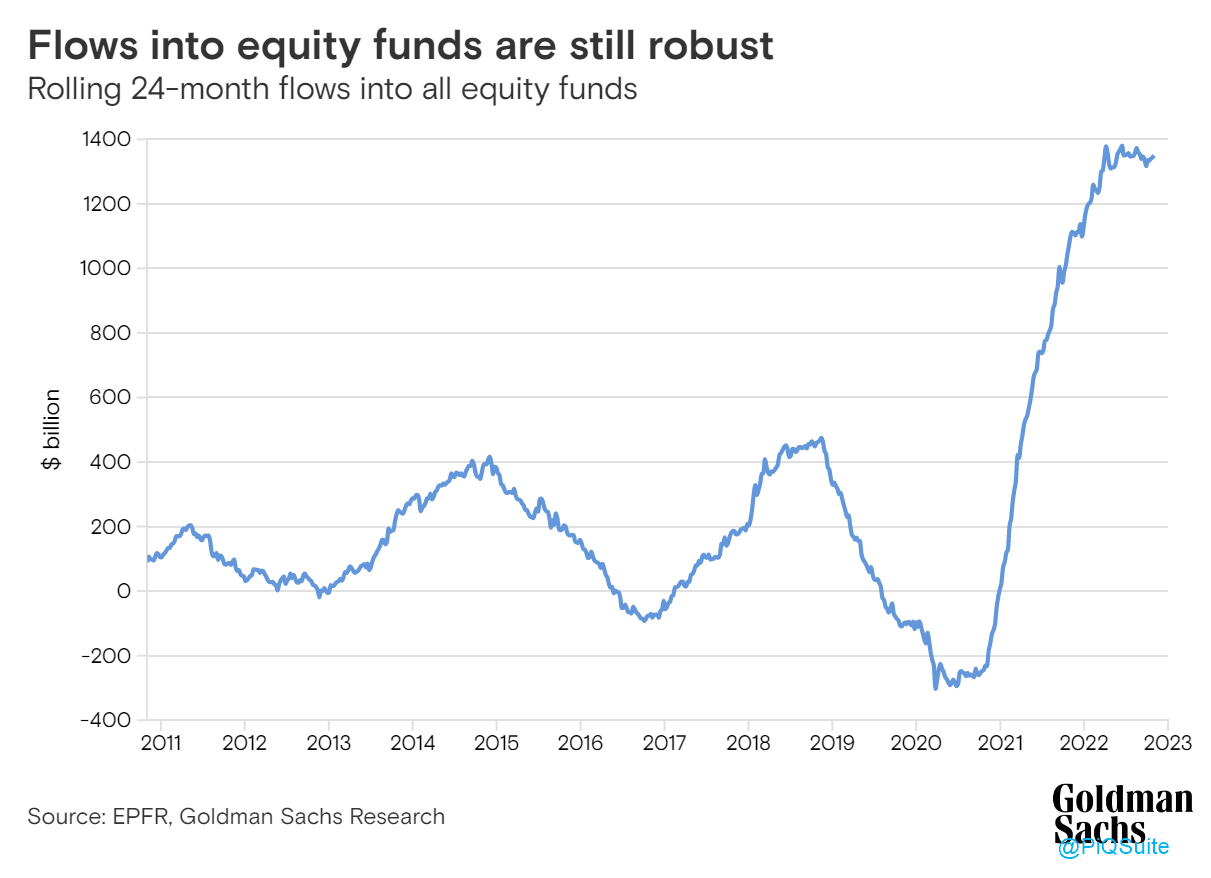
Talking about everyone being bullish, here are cumulative 24-month rolling flows into equities as of November. Various times in Jag we’ve mentioned recently that contrary of public opinions, the bulk of selling pressure seen in 2022 has been largely concentrated in Tech. The classic cyclical groups that are impacted when recession “acceptance phase” sets in haven’t been torched yet. How to read this chart: If you overlay the S&P, the last two times when this rolled over (2015-16 and 2018-19 which were non-recessionary periods), the S&P was flat as the best case scenario with a ton of volatility.
Something is rigged! And I don’t put this lightly, but something is definitely off here. The Household Survey shows net change in past 8 months in labor market is only +120,000 while the Department of Labor NFP data shows +2.69 million. Who is lying? One or two months of wide disparity can be ignored but these two employment surveys over a long period of time like 8 months are never this far apart. Funny thing is this sort of divergence was last seen during the 2nd term of Obama Administration. See how these two surveys are measured HERE

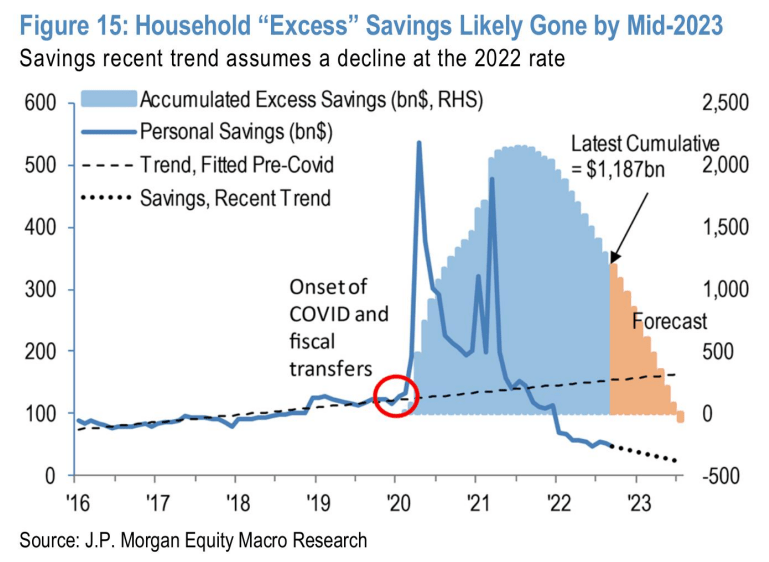
The unfortunate part about blindly believing tweets is there is a lot of misinformation often spread by even the verified guys with blue checkmarks and 100,000 followers. Saw someone tweeting consumers have $2.4 trillion saved from pandemic checks. Entirely wrong! It is $1.18 trillion and has been rapidly depleting all year, projected to go to zero by mid 2023. Keep this mind when you think about mall retailers with high inventories that reported string of guidance cuts last week one week after Thanksgiving shopping season.
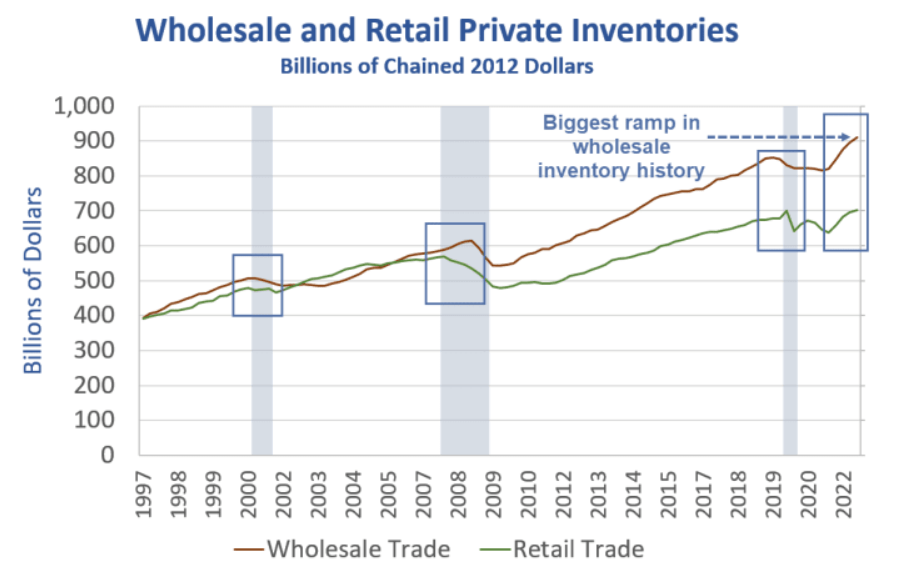
Talking about inventories in the channel, quote from ISM Manufacturing Survey last week: “ISM’s Customers’ Inventories Index registered 48.7 percent. Six industries reported customers’ inventories as too high in November, in the following order: Textile Mills; Paper Products; Wood Products; Primary Metals; Chemical Products; and Electrical Equipment, Appliances & Components.” — A key common characteristic of every recession is too much excesses in the system. This will remain a big problem in 2023 forcing companies to cut guidance.
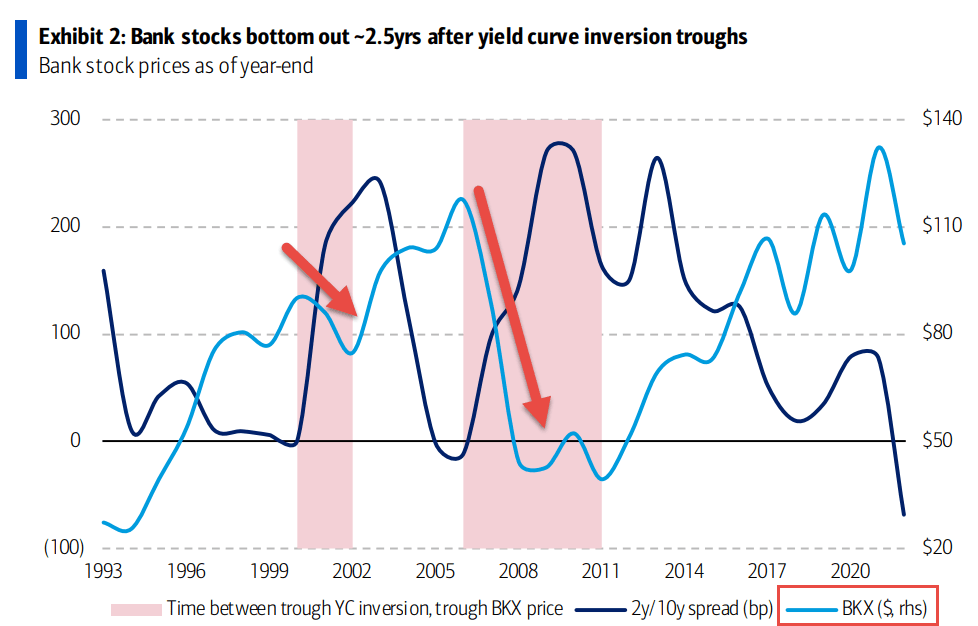
Lets talk banks. With everyone watching closely 10-2 yield spread as a recessionary signal now at -0.80 lowest since early 1980’s, the question really should be how to extract trade ideas from it. With continued macro deterioration, just like every recession, there will come a time when 2-year yield will start responding by crashing, resulting in sharp spike in 10-2 spread. That’s when bank’s start to underperform as net interest margin comes come under pressure. That moment is coming soon in 2023 for XLF components.
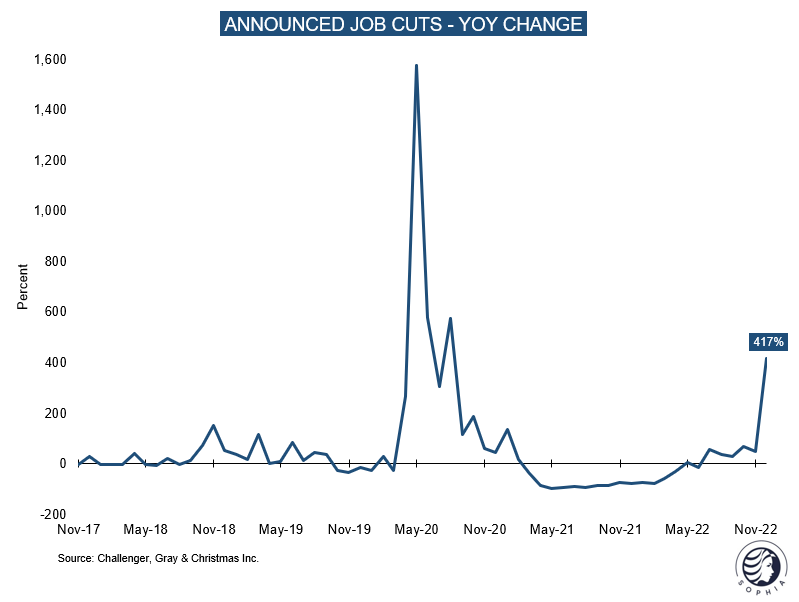
Hiring freezes of past 6 months are turning into layoffs. Challenger Job-Cut revealed +127% m/m increase in cuts (up +417% YoY). So far Tech sector is leading this with 52,771 cuts in November, for a total of 80,978 this year. This is the highest monthly total for the sector since the firm began keeping detailed industry data in 2000. But we should be watching is other sectors showing early signs: Autos with 2nd highest cuts, up +198% YoY, Housing 3rd highest cuts up +187% YoY, banks 4th highest cuts. Next up this will spread to retail and industrials.
South Korea Nov exports fell by -14% YoY vs -11.2% estimate. Trade deficit widened to $7 billion vs $4.3 billion estimate. Nov Semi exports fell by -29.8% YoY. At the heart of this crash is memory (MU, LRCX). Micron reports on Dec 21st and on Nov 16th they highlighted need to cut capex with bit production seen down double digit percentage in 2023. Further, note we’re currently in 60-day comment period before Biden announces strategy action that may include semi export ban to China. The last time when Trump was evaluating similar curbs, Micron crashed to as low as $30 and SMH was under $100.

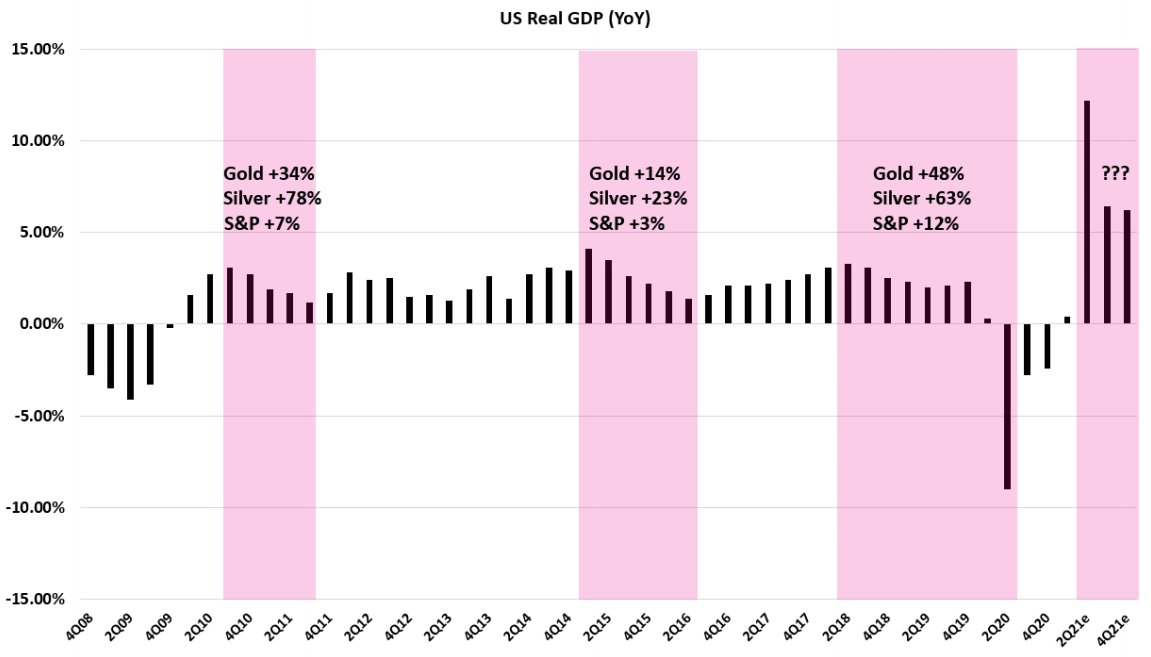
I’ve been riding and rolling calls in GLD and GDX for last couple months. Tweeted this a couple times but context is necessary to repeat. History tells us when US Real GDP is falling, precious metals outperform. My forecast for US Real GDP are: 4Q22 up +2.67% YoY, 1Q23 down -2.83% YoY and 2Q23 down -2.04% YoY. Real simply means nominal minus CPI. Expectation for the next 6 month is growth slowing + inflation slowing (favors Quad 4 playbook which includes XLP, XLU, XLV constituents).