
Conundrum: Market vs Economy
Originally posted October 10
Days like today when major indices crash (Nasdaq now down -10% in less than 2 weeks), the only thing that comes to mind is notion that perhaps we are about to enter into a recession phase. The definition of bear market is -20% decline in major indices so it would seem we are going there fast and that forces a view that perhaps we should just sell everything and go to cash.
But let’s look at some facts:
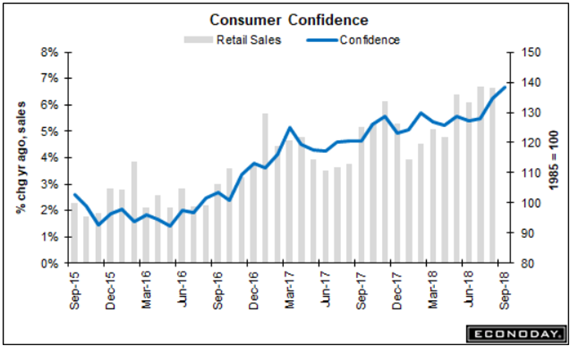
— Two weeks ago, Consumer Confidence in September increased from 132 to 138, highest level in 18 years. This is forward looking indicator and is 92% correlated to retail sales. Tonight Costco is reporting +7.7% growth in US same store sales growth and +25.7% growth in online sales.
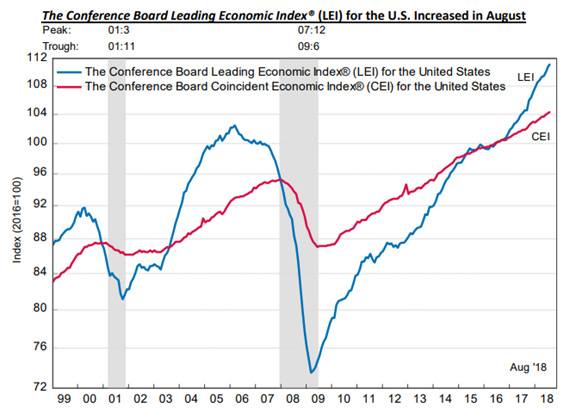
— This is strong and similarly several other forward looking indicators such as Leading Economic Indicator (LEI) accelerated in September and remains strong. LEI is my favorite indicator. Why? Because it never lies and it will give you 6-month warning before a recession is coming. LEI increased +0.4% in August. No slowdown here.
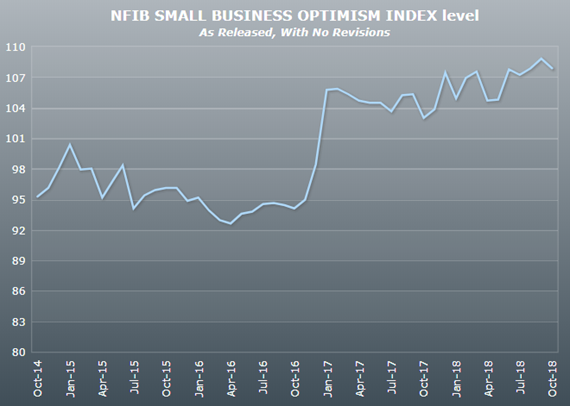
— NFIB Small Business Index for September release yesterday morning was 107.9 which was 3rd highest reading in 45 years of index history. This is also forward looking indicator. Small business optimism is highly sensitive to any smallest change in macro data. No slippage here. Ask your friend or neighbor or cousin who owns a small business how are things going. You will here only positive things.
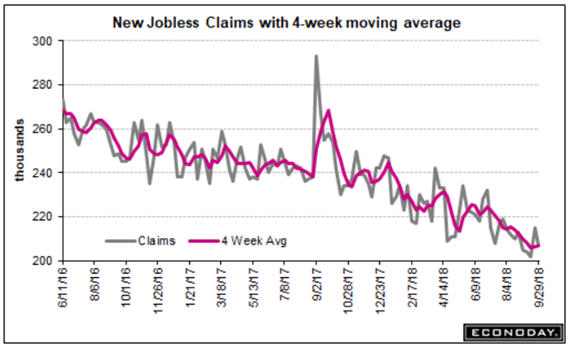
— 4-week moving average of Weekly Jobless Claims is still in low 200,000. This is highly sensitive number that responds very quickly to any material weakness in economy. It is showing no signs of strains here. And just for clarity for those who were spooked by September Announced Layoffs from Challenger Job-Cut Report that jumped to 55,285 vs. 38,472 in August, half of that was driven by Wells Fargo special case announcement as part of major restructuring. Not a depiction of economy.
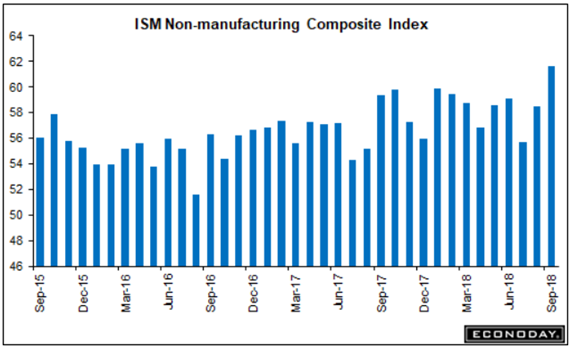
— The ISM Services Index which represents 70% of US economy and is conducted by extensive Q&A of 375 firms nationwide from all sectors, ripped higher to 61.6 in September accelerating from 58.5 in prior month. This is also forward looking indicator and it was the highest reading since the survey was established in 2008. Every part of this survey accelerated (order growth, revenue backlog, hiring plans, etc.). Does this sound like a bear market? Just take a look this chart:
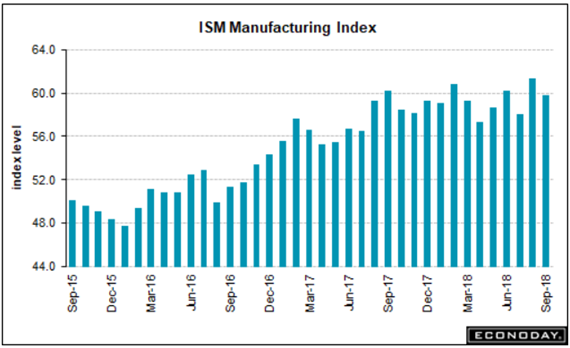
— Similarly ISM Manufacturing Index for September came in at 59.8 (very very strong) and this was further confirmed by Markit PMI data of 55.6 which accelerated from 54.7 level in August. Both reports showed strong evidence of capacity stress as backlogs are building significantly because the order growth rate was fastest in 2 years. This does not happen in falling economy. Understandably, the only negative in these US manufacturing surveys that is spooking people out is rising input costs led by tariffs. But the data simply shows that while input costs may have gone up, order growth remains strong, backlogs remain strong, simply function of strong economy.
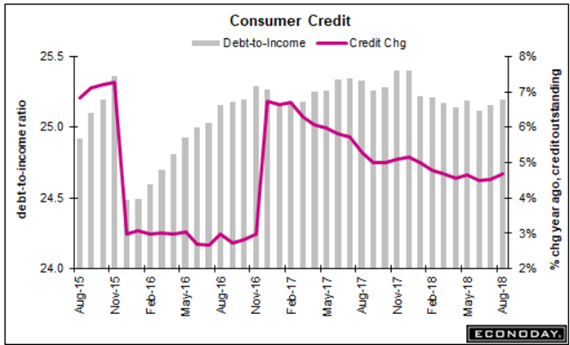
— I will even throw into this another macro indicator we don’t often talk about: Consumer Credit (credit cards, vehicle financing, etc.). Credit formation happens with strong economy. Every single month it has been growth between 6.5% to 7.5%. Absolutely no deterioration here. You simply do not see this when growth is falling apart.
I can show charts after charts on economy. The simple fact is economy is strong! None of this market sell off ties with current or forward looking economic conditions. The data simply doesn’t support the negative view!
Perhaps the Real Risk – So, the question becomes if it is not the economy, what’s out there spooking the market? The most obvious answer is trade dispute with China. I believe jury is still out on this and it is way too early to make any reasonable conclusion how it all ends with China and if it has any material impact on US consumer. This could be real risk and we have been talking about it chat every day. I don’t want to underestimate that. But China is still not showing up in data as big enough problem to throw US economy into recession. Macro data does’t support it.
Kitchen Sink Sell Off – Other things people are worried about in this “kitchen sink” market sell off: Rising interest rate (function of strong economy), Chinese hacking of US data centers (every tech firm has denied already), Mueller investigation (no idea when it will end), mid-term elections with blue wave coming (stalemate might actually be a good thing), September weak seasonality spilling into October (temporary phenomena). Did I miss anything?
At the risk of oversimplification, my assessment of this sell off is simply technical in nature driven by noise (instead of news). This may sound easy way out of answering a difficult question when portfolios are hurting, but we have seen this movie before many times. Dow lost 10% in February with two 1000-point sell offs within one week in February. Was there any fundamental basis for it? Dow lost 1000 point after Trump won elections. After Brexit we had 1500 point sell off (and next day after Brexit I issued a note with titled “Dumpster Fire Politics” creating a buying opportunity). After Ebola and Zika fears we had sell off. Dow lost 1000 points after Russia invaded Ukraine. Dow had series of selling days after Dubai defaulted in debt. In May 2012 we had flash crash and Dow fell 1000 in single session out of nowhere. Do any of these events had any fundamental basis for sell off?
Things sell off sometimes for unexplainable reasons. Noise creates buying opportunities. This is another noise-driven sell off with no basis. We will bounce back from it just like we did before.
Fahad